Quick Summary
- Market structure in trading is the shape price draws through its swing highs and swing lows. It tells you the direction of the market before you risk any money.
- Price is always in one of three states: uptrend, downtrend, or range.
- A move that extends the current trend is a break of structure (BOS). The first move that goes against it is a change of character (CHoCH).
- You can use the same method on a market structure chart for forex, stocks, crypto, or futures.
- Structure gives you direction and a stop-loss level. It does not give you a guaranteed signal.
Imagine driving in a new city without a map. You might still reach your destination, but you would waste time, take wrong turns, and sometimes drive straight into a dead end. Trading without market structure feels exactly like that.
Market structure in trading is the pattern formed by a market’s swing highs and swing lows, and it shows whether buyers or sellers are in control. Traders use it to decide which direction to trade, where to enter, and where their idea is proven wrong.
In this guide, you will learn what market structure is, how to draw it on a chart, how it works in forex and the stock market, and how to avoid the errors that trap most beginners.
Educational content only, not financial advice. Trading carries a high risk of loss.
What Is Market Structure in Trading?
Price never moves in a straight line. It pushes in one direction, pauses, pulls back, and pushes again. Each push and pullback leaves a turning point on the chart. Connect those turning points and you see the market’s structure.
A simple way to remember it: market structure is the trail price leaves behind. Reading that trail tells you where price has been dominant and where it is likely to meet resistance.
Two details matter here:
- Market structure is built from price only. It ignores earnings reports, company news, and opinions.
- It is relative. A swing point only matters when compared with the one before it.
Two meanings of “market structure”
| Context | Meaning | Who uses it |
| Chart analysis | Pattern of swing highs and lows | Traders and technical analysts |
| Market design | How exchanges, brokers, and market makers organize trading | Economists, regulators, institutions |
This guide covers the chart meaning. The design meaning appears briefly in the stock market section.
The Anatomy of Structure: Impulses, Pullbacks, and Swing Points
Before labeling anything, learn the three parts that every structure is made of.
- Impulse: a strong move in the direction of the trend.
- Pullback (retracement): a smaller move against the trend after an impulse.
- Swing point: the turning point where one move ends and the next begins. A swing high is a peak. A swing low is a trough.
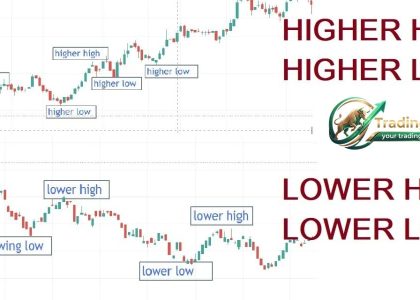
When you compare each new swing point with the previous one, you can name it:
| Abbreviation | Full name | Quick meaning |
| HH | Higher High | New peak above the last peak |
| HL | Higher Low | New trough below the last trough |
| LH | Lower High | New peak below the last peak |
| LL | Lower Low | New trough below the last trough |
Filtering noise: tiny wicks can create false swing points. Many traders only accept a swing point when it is the highest or lowest point among a few candles on both sides. Choose a rule and apply it consistently.
The Three States of the Market
Uptrend (bullish structure)
Price makes higher highs and higher lows. Each pullback is shallower than the push before it, and buyers step in at progressively higher prices. The most important level is the latest higher low. As long as it holds, the uptrend stays alive.
Downtrend (bearish structure)
Price makes lower highs and lower lows. Sellers keep capping rallies at lower levels. The key level is the latest lower high. As long as price stays below it, the downtrend stays intact.
Range (sideways structure)
Price moves between a floor (support) and a ceiling (resistance) without creating meaningful new highs or lows. Neither buyers nor sellers are winning. Many professional traders reduce their trading size in ranges, because breakouts that fail are common.
| Uptrend | Downtrend | Range | |
| Pattern | HH and HL | LH and LL | Flat highs and lows |
| Control | Buyers | Sellers | Balanced |
| Key level | Latest HL | Latest LH | Support and resistance |
| Common plan | Buy pullbacks | Sell rallies | Wait or trade the edges |
How to Read a Market Structure Chart: The 3-Question Method
Instead of memorizing rules, ask three questions every time you open a chart.
Question 1: What are the last two swing highs and last two swing lows?
Zoom out until the major turning points are obvious. Mark them with a line or small dot.
Question 2: Are they rising, falling, or flat?
Rising highs and lows mean an uptrend. Falling highs and lows mean a downtrend. Flat levels mean range.
Question 3: Which single level would prove this picture wrong?
In an uptrend, it is the latest higher low. In a downtrend, it is the latest lower high. This is your invalidation level, and it is also where your stop-loss usually belongs.
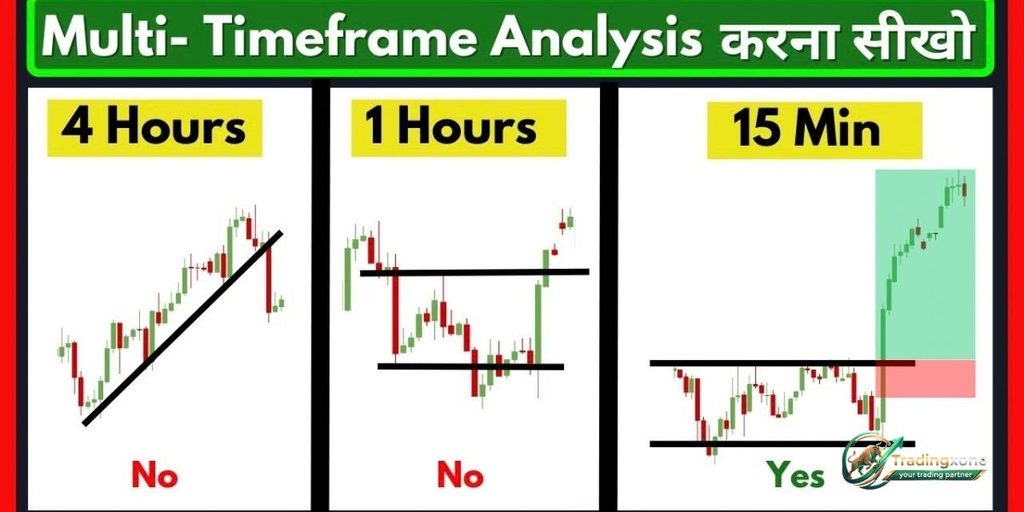
Do this on a higher timeframe first, such as the daily chart. Then repeat on a lower timeframe such as the 1-hour chart to time your entry.
[Insert your own annotated chart image here showing the swing points and the invalidation level.]
Break of Structure (BOS) and Change of Character (CHoCH)
Structure is not static. These two events describe how it evolves.
Break of Structure (BOS) means price pushes beyond the previous swing point in the same direction as the trend. In an uptrend, closing above the previous high is a BOS. The trend has extended.
Change of Character (CHoCH) means price breaks the key level against the trend for the first time. In an uptrend, a drop below the latest higher low is a CHoCH. The market has stopped behaving the way it was behaving.
| BOS | CHoCH | |
| Direction | With the trend | Against the trend |
| Message | “The trend continues” | “The trend may be changing” |
| Uptrend example | New higher high | Break below latest higher low |
| Typical reaction | Look for pullback entries | Tighten risk, wait for proof |
These terms became widely known through ICT and smart money concepts teaching. The underlying idea, however, is the same logic traders have used since the early days of technical analysis.
A word of caution: a CHoCH is a warning, not a reversal guarantee. Price frequently breaks a level, retests it, and then continues in the original direction. Traders also use slightly different definitions, so write down yours and stick to it.
Internal vs. external structure
Many traders separate external structure (the major swing highs and lows that define the main trend) from internal structure (smaller swings inside a single pullback or impulse). A break of internal structure can signal that a pullback has ended. A break of external structure is a much bigger event. Knowing which one you are looking at prevents you from overreacting to small moves.
Where Market Structure Comes From: Dow Theory
The idea of reading highs and lows is more than a century old. Charles Dow published his market observations in The Wall Street Journal between 1900 and 1902, and Robert Rhea later organized them in The Dow Theory (1932).
Dow described three simultaneous trends:
- Primary: the major direction, lasting months to years.
- Secondary: corrections against the primary trend, lasting weeks to months.
- Minor: daily noise, which Dow considered unimportant.
Dow also said a trend should be confirmed by volume and that primary trends move through phases of accumulation, public participation, and excess. Modern market structure borrows this directly. Your higher timeframe structure is the primary trend, pullbacks are secondary trends, and tiny swings are minor noise.
The weakness is also inherited. Dow Theory confirms trends late, and so does structure analysis. You gain reliability but give up the first part of a move.

Market Structure in Forex
The market structure forex traders follow is built on the same swings, but the forex market has a few special features.
- High liquidity: major pairs trade in enormous volume, which usually creates cleaner swings than small, thin markets.
- Session behavior: price often moves more decisively when major sessions overlap and gets choppy when volume is thin.
- News spikes: central bank decisions and economic data can slice through structure within seconds. Many traders step aside before major releases.
- Top-down workflow: read the daily or 4-hour chart for direction, then use the 15-minute or 1-hour chart to refine entries.
Stock Market Structure
When people search for “stock market structure,” they usually mean one of two things.
Chart structure of stocks and indexes. Stocks form the same swing patterns. This is the oldest use of structure analysis, because Dow built his theory on stock market averages. Large, widely traded stocks tend to produce more reliable structure than low-volume shares, where a single order can distort the chart.
The design of the stock market itself. Stocks trade through exchanges that use electronic order books, market makers, and regulation. That design affects liquidity, spreads, and how quickly prices adjust. Understanding it helps you judge trading costs and execution quality, though it does not replace chart analysis.
Choosing the Right Market and Timeframe
Structure is cleaner where many participants trade actively. Major forex pairs, large-cap stocks, major indexes, and large cryptocurrencies are good examples.
| Timeframe | Reliability of structure | Suits |
| 1 to 15 minutes | Often noisy | Scalpers and day traders |
| 1 to 4 hours | Moderate | Day and swing traders |
| Daily and weekly | Usually the clearest | Swing and position traders |
A reliable habit: let the higher timeframe decide direction and the lower timeframe decide timing.
A Worked Example (Hypothetical)
The numbers below are invented to show the thinking process. They are not a real trade or a recommendation.
A stock has been rising on the daily chart. Its recent swing lows are $48 and then $51, and its swing highs are $55 and then $59. That is a clear uptrend with HH and HL.
- Bias: buy only, because structure is bullish.
- Key level: the latest higher low at $51.
- Plan: wait for price to pull back toward the $52 to $53 area instead of chasing it at $59.
- Confirmation: on the 1-hour chart, wait for a small BOS to the upside after the pullback.
- Stop-loss: just below $51. If price closes under it, the uptrend is in doubt.
- Target: the previous high at $59, with a rule to take partial profit there.
- Risk rule: choose the number of shares so a stop-out costs only a small, pre-decided share of your account.
Notice that structure handled direction, entry zone, stop, and target. It also made the loss predictable before you entered.
Mistakes That Cost Traders Money
- Labeling too many swings. More labels do not mean more clarity.
- Treating every CHoCH as a reversal. Wait for a retest or a second signal.
- Trading against the higher timeframe. A small bounce inside a daily downtrend is a trap for many beginners.
- Entering on the break itself. Many breakouts fail. A closing price beyond the level is stronger evidence than a brief wick.
- Ignoring liquidity and news. Thin markets and big announcements can make structure unreliable.
- Having no stop-loss. Even good analysis is wrong sometimes.
What Market Structure Cannot Do
- It cannot predict the future. It describes probabilities.
- It is subjective, so two traders may draw different swings.
- It lags, because you can only label a swing after price has turned.
- It works best together with other tools such as support and resistance, volume, and risk management.
Pre-Trade Checklist
- Higher timeframe structure identified?
- My trade direction matches it?
- Invalidation level marked?
- Recent BOS or CHoCH noted?
- Entry confirmation on the lower timeframe?
- Stop-loss and position size within my risk rules?
Frequently Asked Questions
What does market structure mean in trading?
It means the pattern of swing highs and swing lows on a price chart. That pattern shows whether the market is in an uptrend, a downtrend, or a range.
How many types of market structure are there?
There are three: bullish, bearish, and ranging.
What is a market structure chart used for?
It helps you see trend direction, find the level that would invalidate your trade idea, and spot early signs of a trend change.
Which comes first, BOS or CHoCH?
In an established trend, you normally see BOS events as the trend extends. The first break against the trend is the CHoCH.
Does market structure work in forex?
Yes. Market structure forex analysis uses the same swing logic, and the high liquidity of major pairs often produces clear structure. Traders usually read the higher timeframe first and then refine entries on a lower one.
Is stock market structure different from forex structure?
The chart logic is the same. The difference is in market design, trading hours, and liquidity. The term can also describe how exchanges and market makers organize stock trading.
What is the best timeframe to read market structure?
Daily and weekly charts are usually the clearest. A common method is to read direction on a higher timeframe and time entries on a lower one.
Can I trade using only market structure?
It is not recommended. Structure gives direction and key levels, but you also need entry rules, risk management, and discipline.
Is market structure good for beginners?
Yes. It is one of the first concepts worth learning, because it explains what the market is doing before you add any indicators.
Conclusion
Market structure in trading gives you a map of the market. Mark the swing highs and lows, decide whether the market is trending or ranging, watch for BOS and CHoCH, and always know the level that proves you wrong. Start on higher timeframes, practice on past charts, and protect every trade with a stop-loss.
If you want to keep building your technical analysis skills, you can find more step-by-step trading guides on Trading Xone.
Risk disclaimer: This article is educational and does not constitute investment advice. Trading forex, stocks, crypto, and other instruments involves substantial risk, and you may lose more than you expect. Never trade with money you cannot afford to lose.