Key Takeaways
- Break of structure crypto (BOS) happens when price closes beyond a previous swing high or swing low, confirming that the existing trend is still in control.
- BOS is a trend-continuation signal — not a reversal signal. A reversal signal is called a Change of Character (CHoCH) or Market Structure Shift (MSS).
- A valid BOS needs a full candle-body close beyond the swing point. A wick that pokes past the level without a close is usually a liquidity grab, not a real break.
- Traders rarely enter the moment BOS happens. Most wait for price to retest the broken level before taking a position.
- BOS works on every timeframe — from a 1-minute scalping chart to a weekly macro chart — but it is far more reliable on higher timeframes and liquid pairs like BTC and ETH.
Crypto charts move fast, and it is easy to mistake random noise for a real trend change. That is exactly the gap that break-of-structure crypto analysis is built to close. It is one of the core building blocks of Smart Money Concepts (SMC) and the Inner Circle Trader (ICT) methodology, and once you can spot it, reading a Bitcoin or Ethereum chart stops feeling like guesswork.
This guide explains what a break of structure in trading actually is, walks through real break of structure examples, shows how break of structure trading fits into a full strategy, and answers the most common questions traders search for. Everything below is written for traders who already understand candlesticks and want a precise, practical framework — not vague theory.
What Is a Break of Structure in Trading?
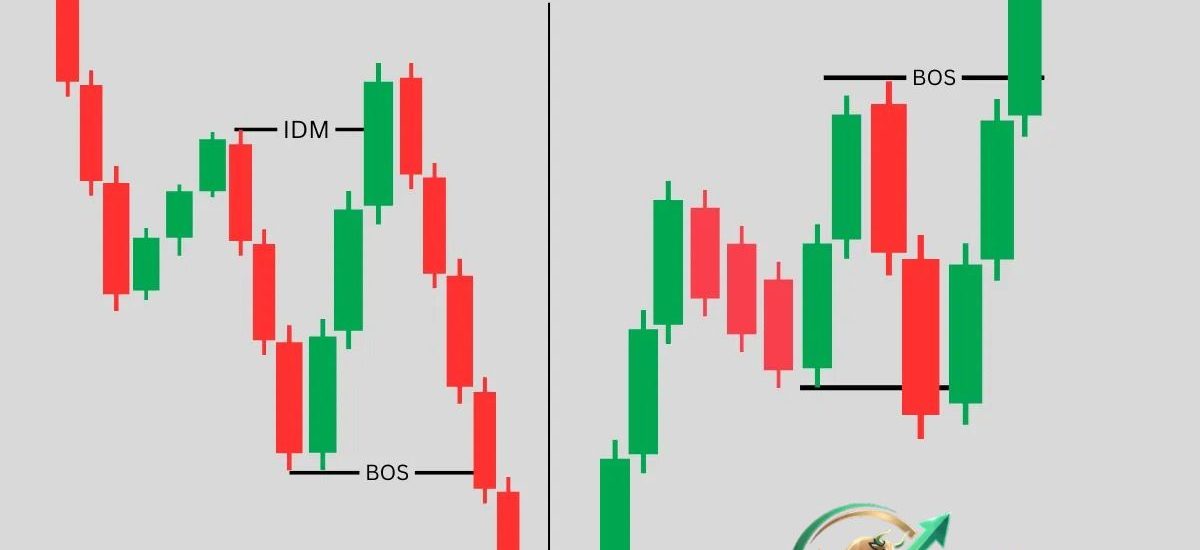
A break of structure (BOS) occurs when price closes beyond the most recent significant swing high (in an uptrend) or swing low (in a downtrend), confirming that the dominant trend remains intact. It is the market’s way of “re-confirming” itself.
To understand BOS, you first need to understand how market structure is built. Price generally moves in one of three states:
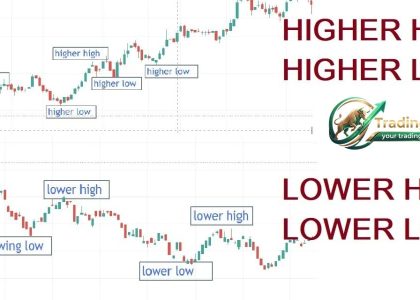
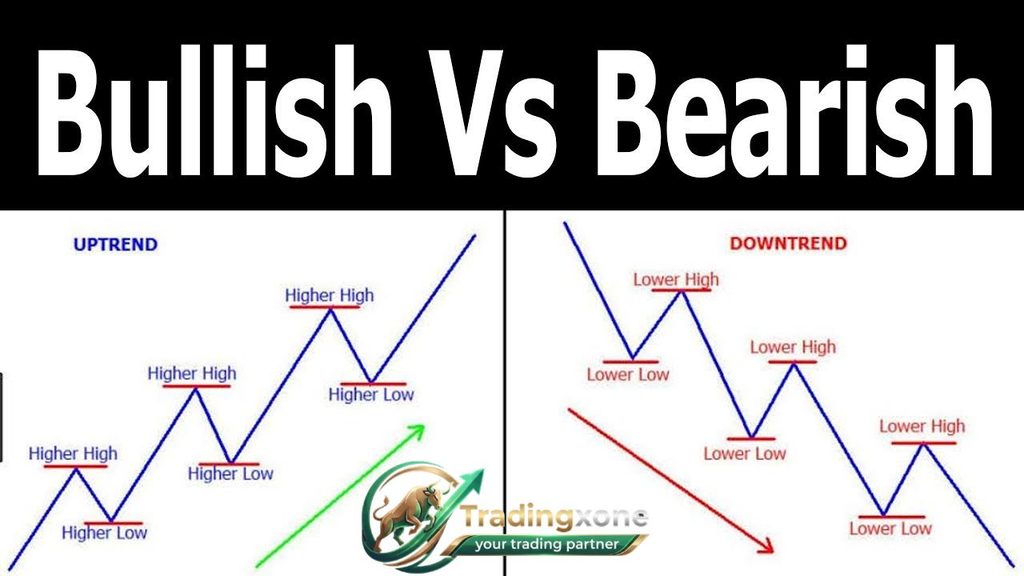
- Uptrend — a series of Higher Highs (HH) and Higher Lows (HL)
- Downtrend — a series of Lower Highs (LH) and Lower Lows (LL)
- Consolidation/range — no new structural highs or lows are being made
A break of structure simply means the trend has produced another higher high (bullish BOS) or another lower low (bearish BOS). It tells you the side currently in control — buyers in an uptrend, sellers in a downtrend — still has enough strength to push through the last major level.
You can also read about Smart Money Concept in Crypto.
This distinguishes BOS from a reversal signal. When price breaks a level against the prevailing trend instead — for example, breaking below a Higher Low during an uptrend — that is called a Change of Character (CHoCH) or Market Structure Shift (MSS), and it’s the first warning sign that control may be changing hands.
Break of Structure vs. CHoCH: Why the Difference Matters?
This is one of the most searched questions in the break of structure in the trading space, and getting it wrong can cost you trades.
| Concept | What It Signals | Direction Relative to Trend |
| BOS (Break of Structure) | Trend continuation | Breaks with the trend |
| CHoCH (Change of Character) | Early reversal warning | Breaks against the trend |
| MSS (Market Structure Shift) | Confirmed reversal | Breaks against the trend, with follow-through |
In short: BOS says “the trend is still healthy.” CHoCH says “pay attention, something might be changing.” Confusing the two is one of the fastest ways new traders misread a chart, especially in crypto where wicks and fakeouts are common.
Bullish vs. Bearish Break of Structure
Bullish BOS
A bullish break of structure forms during an uptrend. Price makes a Higher High, pulls back to form a Higher Low, then rallies again. The moment price closes a candle above that prior Higher High, a bullish BOS is confirmed — signaling the uptrend is likely to continue.
Bearish BOS
A bearish break of structure forms during a downtrend. Price makes a Lower Low, corrects upward to a Lower High, then falls again. When price closes a candle below the prior Lower Low, a bearish BOS is confirmed — signaling continued downward pressure.
Break of Structure Examples
Real break of structure examples make the concept click faster than theory alone.
Example 1 — Bullish BOS on BTC/USDT (4-hour chart): Bitcoin forms a Higher Low near a demand zone, then rallies through the previous swing high with a strong, full-bodied candle. Volume expands on the breakout candle, and price does not immediately reverse. This is a textbook bullish BOS — traders watching for continuation would look for a retracement back into the broken level (now acting as support) before entering long.
Example 2 — Bearish BOS on ETH/USDT (1-hour chart): Ethereum is in a clear downtrend of Lower Highs and Lower Lows. Price corrects up to a Lower High, stalls, then closes below the prior Lower Low with displacement (a large, decisive candle). This confirms sellers are still in control, and a short entry on the retest of the broken level would align with the trend.
Example 3 — False break (liquidity grab): Price wicks above a swing high but the candle closes back inside the previous range. No full-body close occurred, so this is not a valid BOS — it’s more likely a liquidity grab designed to trigger stop-losses above resting buy orders before price reverses.
These break of structure examples highlight the same rule again and again: the close is what confirms the break, not the wick.
How to Trade a Break of Structure in Crypto
Chasing the breakout candle itself is one of the most common mistakes new traders make. Professional break of structure trading usually follows this sequence instead:
- Identify the trend — map out the swing highs and lows on your chart to establish whether the market is trending or ranging.
- Wait for the BOS — confirm a full candle-body close beyond the relevant swing point.
- Mark the Order Block — the last opposing candle before the impulsive move that caused the BOS is often treated as an institutional entry zone.
- Wait for the retest — let price pull back to the broken level or into a Fair Value Gap (FVG) before entering, rather than entering on the initial break.
- Confirm with volume and multi-timeframe alignment — a genuine BOS is typically backed by rising volume, and it should agree with the trend on a higher timeframe.
- Manage risk — place stops beyond the recent swing point and size positions according to your risk tolerance; crypto’s 24/7 volatility means stops can be hit even on valid setups.
Because crypto markets never close, weekend and low-liquidity breaks are notoriously unreliable — a BOS that forms during thin Sunday trading deserves extra skepticism until it holds up once major markets reopen.
Best Timeframes and Assets for Break of Structure Trading
BOS is a fractal concept; it appears on every timeframe, from 1-minute charts to monthly charts — but its reliability changes with context:
- Daily/Weekly used to set the macro trend bias
- 4-hour/1-hour: the sweet spot for swing traders identifying structural shifts
- 15-minute/5-minute used by day traders for entries, ideally only after confirming a higher-timeframe BOS first
For assets, high-liquidity, highly technical markets work best: BTC, ETH, and large-cap altcoins tend to respect structure more cleanly than thinly traded, low-volume tokens where a handful of large orders can distort the chart.
Common Mistakes When Trading Break of Structure
- Trading wick breaks as confirmed BOS: Always wait for the candle to close.
- Ignoring the higher timeframe: A bullish BOS on a 5-minute chart means little if the 4-hour trend is bearish.
- Entering immediately on the break: Instead of waiting for a retest, which usually offers a better risk-to-reward entry.
- Skipping volume confirmation: A break of structure without expanding volume is more likely to be a trap.
- Treating BOS as a standalone strategy: Rather than one tool inside a broader framework that includes liquidity, order blocks, and risk management.
FAQs: Break of Structure Crypto
What is a break of structure in trading? A break of structure is when price closes beyond a previous significant swing high or swing low, confirming that the existing trend — bullish or bearish — is continuing rather than reversing.
What is the difference between BOS and a Market Structure Break (MSB)? BOS confirms trend continuation, breaking a level in the same direction as the trend. An MSB (or MSS) occurs when price breaks a level against the trend, signaling a potential reversal.
Is break of structure only used in crypto? No. BOS originates from classical price-action and Dow Theory concepts and is used across forex, indices, stocks, and crypto. Crypto’s volatility and 24/7 trading make BOS setups appear more often, but also increase the chance of false breaks.
Can I trade break of structure on a 1-minute chart? Yes, but lower timeframes carry more noise. It’s best practice to confirm a higher-timeframe (1-hour or 4-hour) directional bias before acting on a lower-timeframe BOS.
Do I need indicators to identify a break of structure? No — BOS is a pure price-action concept based on swing highs, swing lows, and candle closes. Some traders use SMC-focused indicators on platforms like TradingView purely to visualize levels faster, but they are not required.
Why did price break the high and then reverse anyway? This usually means the “break” was only a wick, not a confirmed close — a liquidity grab designed to sweep stop-losses before reversing. Waiting for a full candle-body close filters most of these out.
You can also read about Smart Money Concepts.
Final Thoughts
Break of structure crypto analysis will not predict every move, and no price-action framework does. What it gives you is a consistent, rules-based way to read whether a trend is still in control or starting to lose momentum, instead of relying on gut feeling. Traders following communities like Trading Xone often pair break-of-structure trading with liquidity concepts, order blocks, and strict risk management — that combination, not any single signal, is what separates a repeatable process from guessing. Start by marking swing highs and lows on a higher timeframe, practice spotting confirmed closes versus wick fakeouts, and only then bring the concept down to your entry timeframe.
This article is for educational purposes only and does not constitute financial or investment advice. Cryptocurrency trading carries significant risk; always do your own research and manage risk according to your own circumstances.