Key takeaways
- Market structure is the pattern of swing highs and swing lows that shows whether a market is trending up, trending down, or moving sideways.
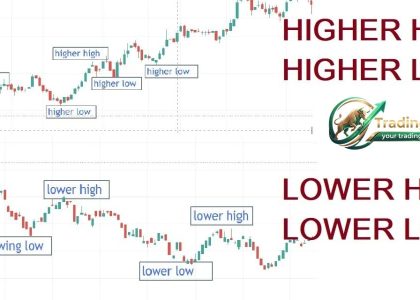
- An uptrend is higher highs plus higher lows. A downtrend is lower highs plus lower lows. A range is neither.
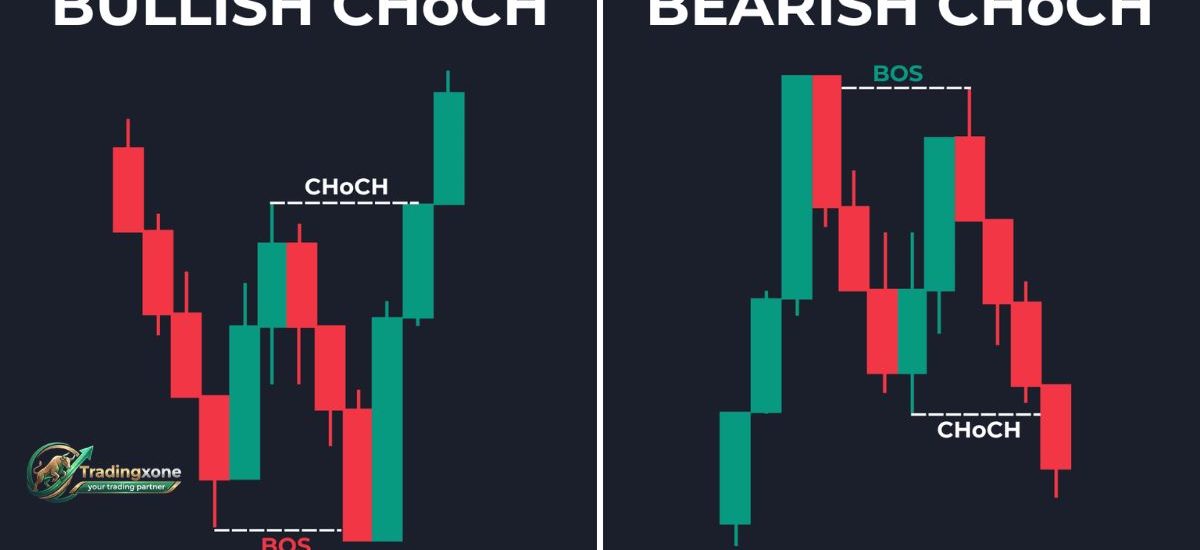
- A Break of Structure (BOS) suggests the trend is continuing. A Change of Character (CHoCH) is an early warning that it may be changing.
- It works on any market and timeframe, including forex and stocks, but it describes what price is doing. It does not predict what price will do.
- Always confirm on a higher timeframe and define your risk before entering.
What Is Market Structure in Trading?
Market structure in trading is the way price moves through a sequence of swing highs and swing lows, which reveals whether buyers or sellers are in control and whether the market is trending or ranging.
Think of it as the skeleton of a price chart. Individual candles are noise. The turning points between them are the structure. Traders read that structure to decide which direction to favour, where to look for entries, and where their idea is proven wrong.
The idea is not new. Charles Dow described trends as sequences of rising or falling peaks and troughs more than a century ago. Modern price action, Smart Money Concepts and classic technical analysis all rest on that same foundation.
Why Market Structure Matters
It gives you context before you look at anything else. Indicators tell you what has already happened to price. Structure tells you where price sits within its current story.
- Direction: it tells you which side has been winning.
- Location: it shows where previous turning points sit, which often become support and resistance.
- Invalidation: it gives a logical place to say “I was wrong”, which makes stop-loss placement less arbitrary.
- Discipline: it stops you from buying every dip in a downtrend or shorting every rally in an uptrend.
Academic work supports the idea that chart patterns can hold information. Lo, Mamaysky and Wang (2000) built a systematic way to identify technical patterns and tested them (see NBER Working Paper 7613). That is not a promise of profits. It is a reason to treat structure as one input among several.
The Building Blocks: Swing Highs and Swing Lows
What is a swing high?
A swing high is a peak with lower prices on both sides. Buyers pushed price up, ran out of strength, and sellers took over.
What is a swing low?
A swing low is a trough with higher prices on both sides. Sellers pushed price down, ran out of strength, and buyers stepped in.
The four labels you need
| Label | Meaning | What it suggests |
| HH (higher high) | New peak above the previous peak | Buyers pushing further |
| HL (higher low) | Pullback that holds above the previous trough | Buyers defending dips |
| LH (lower high) | Rally that fails below the previous peak | Sellers capping rallies |
| LL (lower low) | New trough below the previous trough | Sellers pushing further |
The Three Types of Market Structure
Bullish market structure
Price prints higher highs and higher lows. Each pullback is shallower than the rally before it, and buyers keep stepping in at higher prices. The structure stays bullish until price makes a lower low.
Bearish market structure
Price prints lower highs and lower lows. Rallies fail early and sellers push to new lows. The structure stays bearish until price makes a higher high.
Sideways (ranging) market structure
Price bounces between a fairly stable high and low. Highs and lows are roughly equal, momentum is weak, and false breakouts are common. Ranges often precede large moves, but nobody can know the direction in advance.
| Bullish | Bearish | Sideways | |
| Highs | Higher | Lower | Roughly equal |
| Lows | Higher | Lower | Roughly equal |
| Who controls price | Buyers | Sellers | Neither |
| Typical approach | Look for buys on pullbacks | Look for sells on rallies | Trade the range or wait |
How to Read a Market Structure Chart
A market structure chart is any price chart with the swing points marked and labelled. Here is a simple routine:
- Start on a higher timeframe. Open the daily or 4-hour chart so you see the bigger picture first.
- Mark the major swing highs and lows. Ignore tiny wiggles. Only mark pivots that clearly changed direction.
- Label the sequence. Write HH, HL, LH or LL beside each pivot.
- Classify the market. Rising sequence means bullish, falling means bearish, flat means range.
- Note the key levels. The most recent swing high and swing low are the levels that matter most. A break of either changes the story.
- Drop to a lower timeframe only after you know the higher-timeframe bias.
Figure suggestion for your page: an annotated candlestick chart of an uptrend with HH/HL labels, then the same chart at the point where price breaks the last higher low. Alt text: “Market structure chart showing higher highs, higher lows and a change of character.”
Break of Structure (BOS) vs Change of Character (CHoCH)
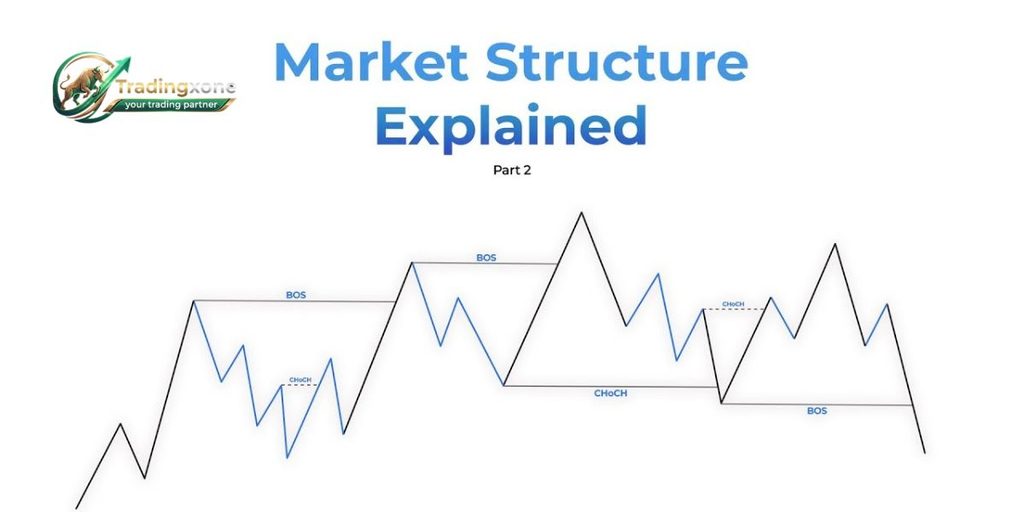
- Break of Structure (BOS): price breaks the previous swing high in an uptrend, or the previous swing low in a downtrend. It suggests the trend is continuing.
- Change of Character (CHoCH): price breaks the swing point that would normally hold in the current trend. In an uptrend, that is a break below the last higher low. It is an early sign of weakening momentum.
| BOS | CHoCH | |
| Direction of break | With the trend | Against the trend |
| What it signals | Continuation | Possible reversal |
| Reliability | Moderate | Needs confirmation |
| Common mistake | Chasing after the break | Calling a reversal too early |
Some traders also use “market structure shift” (MSS) for the same idea as CHoCH. Terms vary between educators, so learn the logic and not just the labels. A CHoCH is not a confirmed reversal. Price can break a higher low and then resume the uptrend.
Market Structure in Forex
Forex is one of the most popular arenas for structure trading because it trades around the clock on weekdays and produces clean swings on many pairs.
- Sessions matter. Structure often develops during the London and New York sessions, when liquidity is highest. Asian-session ranges are frequently broken later.
- News can override structure. Central bank decisions and major data releases can print a swing high or low in seconds.
- Use pips for risk. Measure the distance from entry to your invalidation level (the last swing point) in pips, then size the position from there.
- Higher-timeframe bias first. A 15-minute buy in a bearish daily structure is a counter-trend trade, and it needs a much higher bar of evidence.
Stock Market Structure
“Stock market structure” has two meanings, and it helps to know both.
1. Price structure in stocks and indices. Everything above applies to shares, ETFs and indices. Stocks add a few quirks:
- Overnight gaps. Stocks close and reopen, so price can jump past a swing level without trading at it.
- Earnings and news. Single-stock structure can break on results, so many traders avoid holding through them.
- Relative strength. Comparing a stock with its index shows whether it is leading or lagging. Dow Theory’s idea of related averages confirming each other is the classic version of this.
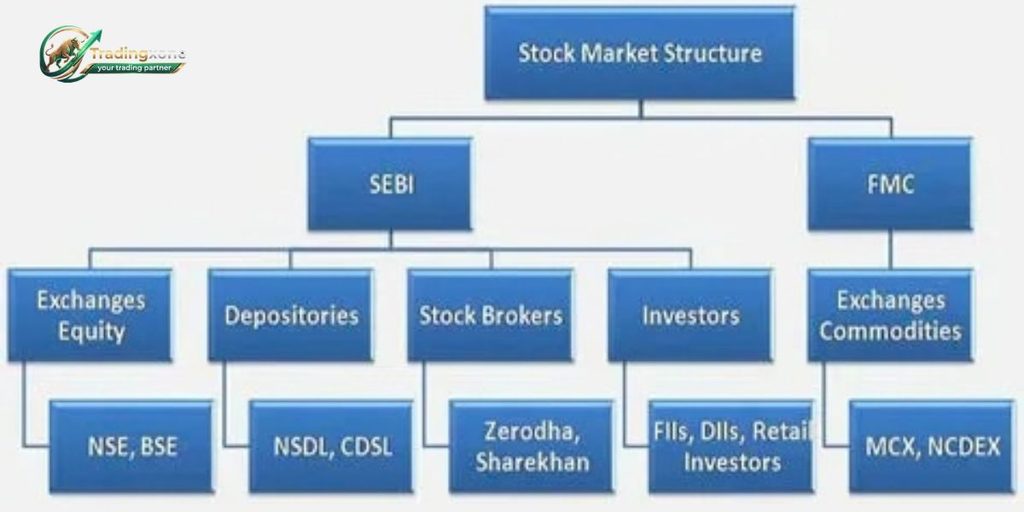
2. How the market itself is organised. In another sense, stock market structure means the plumbing: exchanges, market makers, order types and the rules that connect buyers and sellers. This is often called market microstructure. It affects spreads and execution, but it is a different topic from reading swings on a chart.
Why Multi-Timeframe Structure Matters
Different timeframes can show different structures at once: the weekly can be bullish, the 4-hour can be in a correction, and the 15-minute can be ranging. None of them is wrong. They describe different scales.
A practical hierarchy:
- Higher timeframe (daily/4-hour): sets the bias.
- Middle timeframe (1-hour): shows the setup.
- Lower timeframe (15-minute/5-minute): refines entry and stop.
The higher timeframe wins when signals conflict.
A Simple Market Structure Trading Framework
This is an educational example, not a signal or a guarantee.
- Identify the higher-timeframe structure.
- Wait for price to reach a level of interest, such as a prior swing point or a support/resistance zone.
- Look for confirmation on a lower timeframe, such as a break of structure in your direction.
- Place the stop beyond the swing point that would prove the idea wrong.
- Size the position so a stop-out costs an amount you have decided in advance, commonly a small fixed percentage of the account.
- Set a target at the next logical level and check that the reward is meaningfully larger than the risk.
Illustrative numbers (hypothetical): on a bullish 4-hour chart, price pulls back to a prior higher low, then breaks the small swing high on the 15-minute chart. You enter, place the stop 25 pips below the pullback low, and target a level 75 pips away. That is a 1:3 risk-to-reward, but only if the structure holds. Many setups like this fail, which is why the position size matters more than the entry.
Common Market Structure Mistakes
- Calling reversals too early. A single lower low does not always end an uptrend.
- Marking too many swings. If everything is a swing point, nothing is.
- Ignoring the higher timeframe. This is the fastest way to trade against the dominant flow.
- Chasing breaks. Entering after a large impulsive candle often means buying near a short-term top.
- Skipping risk management. A good read of structure still produces losing trades.
Limitations of Market Structure
Being honest about the limits makes you a better trader:
- It is subjective. Two traders can mark different swings on the same chart.
- It lags. A pattern needs to complete before you can label it.
- It is descriptive, not predictive. Structure shows the current balance of power. News, liquidity and sentiment can change it instantly.
- It fails in choppy markets. In tight, noisy ranges, signals multiply and quality drops.
Test any approach on a demo account or with small size before committing meaningful capital.
FAQ
What is market structure in trading?
Market structure is the pattern of swing highs and swing lows on a price chart. It shows whether the market is in an uptrend, downtrend or range, and which side is currently in control.
What is market structure in forex?
It is the same concept applied to currency pairs. Traders mark swing points on forex charts to find trend direction, then combine that with session timing, news risk and pip-based risk management.
How do you identify market structure on a chart?
Mark the significant swing highs and swing lows, then label them HH, HL, LH or LL. Rising highs and lows mean bullish, falling highs and lows mean bearish, and flat ones mean a range.
What is the difference between BOS and CHoCH?
A BOS breaks a swing point in the direction of the trend and suggests continuation. A CHoCH breaks a swing point against the trend and is an early warning of a possible reversal.
What is the best timeframe for market structure?
No timeframe is universally best. Day traders often use 5- to 60-minute charts. Swing traders use 4-hour, daily and weekly charts. Most traders check a higher timeframe for bias before acting on a lower one.
Can market structure predict price?
No. It describes what price has been doing and helps you frame probabilities. It cannot forecast news or sudden shifts in sentiment.
Does market structure work for stocks and crypto?
Yes. It applies to any liquid market, but each behaves differently. Stocks gap overnight, forex is heavily news-driven, and crypto can be very volatile and trades around the clock.
Conclusion
Market structure gives you a clear, rules-based way to read a chart: find the swings, label the sequence, identify the trend, and respect the levels that would prove you wrong. It will not predict the future, but it stops you from trading blind.
Start by marking structure on daily charts of your favourite forex pairs or stocks, then practise on a demo account. If you want more step-by-step technical analysis guides, you can find them at Trading Xone.
Risk disclaimer: Trading forex, stocks and other leveraged products involves significant risk of loss and is not suitable for everyone. This article is for educational purposes only and is not financial advice.