

Key takeaways
- Smart money concepts (SMC) is a price-action framework that reads market structure, liquidity and price imbalances to estimate where large participants have resting orders.
- The working sequence is simple: higher-timeframe bias → liquidity → point of interest → lower-timeframe confirmation → defined risk.
- Research supports part of the premise: stop-loss orders cluster at predictable prices and can accelerate moves. No rigorous public study shows the full SMC framework is profitable on its own.
- Most SMC losses come from process failures: too many zones on the chart, ignoring higher timeframes, and no risk plan.
- Do not trade it live until you have logged at least 100 trades from a written rule set on historical or demo data.
Risk warning: This guide is educational and is not financial advice. Trading leveraged products is high risk. European regulators’ 2018 analysis found that 74–89% of retail CFD accounts lose money (ESMA).
Global foreign exchange trading averaged $9.6 trillion per day in April 2025, according to the Bank for International Settlements. No retail order moves a market that size. Yet large orders do move price locally, and they can only be filled if someone is willing to take the other side.
That single constraint is the idea behind smart money concepts. If big participants need liquidity to get filled, then price should behave in recognizable ways around the places where liquidity sits: obvious highs and lows, stop clusters, and zones where one side overwhelmed the other.
SMC gives traders a vocabulary and a checklist for reading those places. It is also one of the most hyped and most misunderstood topics in retail trading. This guide covers every core concept in plain language, shows how the pieces combine into entry models and strategies, explains risk and testing, and is honest about what the evidence does and does not support.
If you are new, read the sections in order. If you already trade SMC, jump straight to Entry Models, Stop Placement or How to Backtest SMC.
This guide is the pillar for the smart money concepts series on Trading Xone, and it anchors the more focused walkthroughs linked throughout the article and listed under Continue Learning at the end.
In this guide
- Foundations: What SMC is · Why it matters
- Structure: Market structure · BOS · CHoCH · Internal vs external
- Liquidity: Liquidity · Equal highs and lows · Sweeps
- Zones and imbalances: FVGs · Order blocks · Breaker blocks · Imbalances · Rebalancing · Premium/discount · OTE · Supply/demand
- Advanced concepts: Displacement · Propulsion blocks · CISD · BPR · Breakaway gaps · SMT
- Execution: Entry models · Strategies · London · New York · Power of Three
- Risk and testing: Stops · Take profits · Confirmation vs anticipation · Backtesting · Mistakes
- Reference: FAQ · Sources
What Are Smart Money Concepts (SMC)?

Smart money concepts (SMC) are a set of price-action tools for reading market structure, liquidity, and price imbalances to estimate where large market participants are likely to have orders. Traders use them to choose entries, stops, and targets that line up with that footprint, instead of reacting to lagging indicators.
“Smart money” is the market’s shorthand for participants with size and resources: banks, hedge funds, asset managers, and market makers. “Concepts” is the important word. SMC is not one indicator or one setup. It is a toolkit of ideas (structure, liquidity, imbalance, value) that you combine into a repeatable process.
You will see the same idea written in many ways: smart money concept, smart money concept trading, SMC trading. They all point to the same framework.
Where SMC came from
The modern label traces back to Michael J. Huddleston, who teaches under the name Inner Circle Trader (ICT). His material popularized terms like order block, fair value gap, and liquidity sweep through online videos in the 2010s. As one industry summary puts it, ICT is Huddleston’s specific methodology, while SMC is the broader community category that borrows most of the same ideas.
The roots go back further. Richard Wyckoff described a “composite operator” accumulating and distributing positions in the early twentieth century, and traders drew supply and demand zones long before the term order block existed. LuxAlgo’s concept library makes the same point: the ideas are older than the branding.
| Wyckoff method | ICT | SMC (community usage) | |
|---|---|---|---|
| Era | Early 1900s | 2000s onward, mainstream from the 2010s | 2010s onward |
| Core idea | A “composite operator” accumulates and distributes | Price is delivered between liquidity pools by an algorithmic logic | Institutions leave footprints in structure and liquidity |
| Typical timeframe | Daily and higher, volume-heavy | Intraday, time-and-price focused (sessions, kill zones) | Any timeframe, mostly price-only |
| Vocabulary | Springs, upthrusts, phases | Kill zones, OTE, SMT, CISD | BOS, CHoCH, order blocks, FVGs |
You do not need to adopt ICT’s full system to use SMC. Most traders pick a small subset and master it.
Why Smart Money Concepts Matter
Smart money concepts matter because they change the question you ask of a chart. Instead of “which indicator is flashing?”, you ask “where are the orders, who is likely trapped, and where does this trade become wrong?” That shift produces three practical benefits.
1. It is built on a real market constraint. Large orders cannot be filled instantly at one price without moving the market. Participants scale in and out, and they need counterparties. That is why price often reacts around obvious levels where many orders rest.
2. There is genuine research behind the “orders cluster” premise. Economist Carol Osler analyzed the order book of a major foreign exchange dealing bank, covering 9,655 orders worth over $55 billion between August 1999 and April 2000. Stop-loss orders made up 43% of orders by volume, and both stop-loss and take-profit orders bunched at round numbers, with almost 10% at rates ending in “00” (New York Fed Staff Report 150). She also found that exchange rates moved unusually fast when they reached levels where stop-loss orders cluster, consistent with stops triggering in waves (Osler, 2005).
3. It forces you to define your exit before you enter. Every SMC concept has an invalidation point. That makes risk management natural rather than an afterthought.
What the evidence does and does not support
Honesty about limits is what separates education from marketing. Here is where things stand:
| Claim | Status | What we can say |
|---|---|---|
| Stop and pending orders cluster at predictable levels | Supported | Documented in dealer order-book data (Osler). The data is FX-specific and from 1999–2000. |
| Obvious levels attract fast, stop-driven moves | Supported | Osler found faster trends near stop clusters, for hours rather than days. |
| Support and resistance levels can predict short-term reversals | Partly supported | In a separate study of published intraday levels, prices bounced off them 60.8% of the time versus 56.2% for arbitrary levels, with predictive power varying by currency and provider (Osler, 2000). |
| Institutions deliberately hunt individual retail stops | Contested | The defensible version is that obvious levels attract stop-driven volatility. Targeting specific retail traders is unproven. |
| The full SMC framework is profitable on its own | Unproven | No rigorous, public, independent study demonstrates this. Results depend on the trader’s rules, risk control, and testing. |
Regulators show why the last row matters. The European Securities and Markets Authority, drawing on national regulators’ analyses in 2018, reported that 74–89% of retail CFD accounts lose money. Learning a framework is not the same as having an edge, and leverage magnifies the difference.
Treat SMC as a structured way to read price whose value you must test yourself.
Market Structure
Market structure is the sequence of swing highs and swing lows that shows who is in control: buyers, sellers, or neither. Every smart money concepts strategy depends on it, because bias, zones, and entries are all read from structure.
- Uptrend (bullish structure): higher highs (HH) and higher lows (HL). Buyers are in control.
- Downtrend (bearish structure): lower highs (LH) and lower lows (LL). Sellers are in control.
- Range: price oscillates between a high and a low without making progress.
A swing high is a candle whose high is higher than the highs of the candles on either side. A swing low is the mirror image. Pick one definition and stay with it. A common choice is a three-candle swing on the timeframe you are marking, with a wider five-candle swing on higher timeframes to filter noise.
| Structure | Pattern | Bias |
|---|---|---|
| Bullish | HH + HL | Look for buys in discount |
| Bearish | LH + LL | Look for sells, in premium |
| Range | Equal or overlapping swings | Wait, or trade range edges with tight risk |
How to mark it properly
- Start on a higher timeframe (Daily or 4-hour) and mark the major swings.
- Drop one timeframe and mark the swings inside the last major leg.
- Do not mark every wiggle. If two experienced traders would disagree about a swing, it is probably noise.
Break of Structure (BOS)
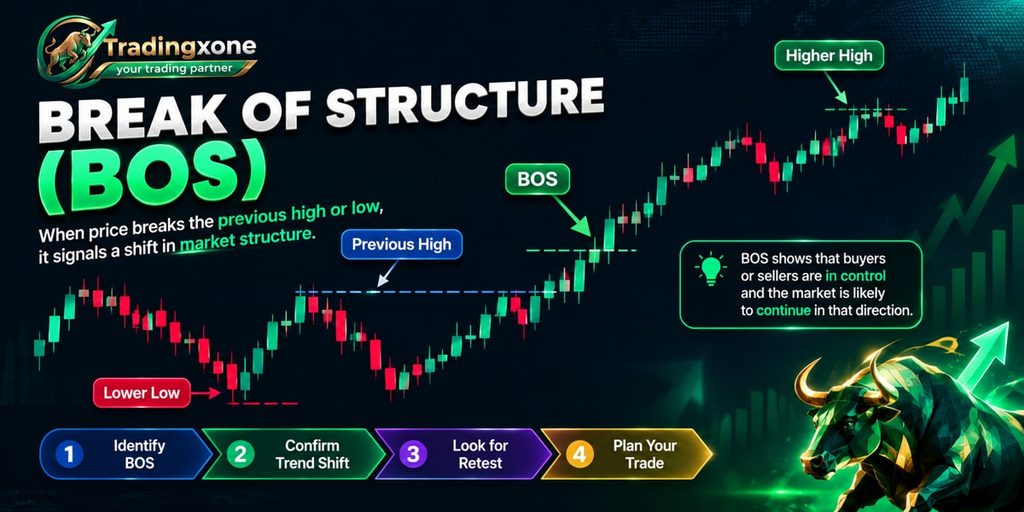
A break of structure (BOS) occurs when price closes beyond the previous swing high or swing low in the direction of the prevailing trend, confirming that the trend is continuing.
In an uptrend, a bullish BOS is a candle close above the last swing high. In a downtrend, a bearish BOS is a close below the last swing low.
Rules that keep BOS honest
- Use closes, not wicks. A wick through a high without a close above it is usually a liquidity sweep, not a break.
- Look for displacement. A BOS made by large, one-directional candles that leave imbalance behind shows conviction. A BOS made by small overlapping candles is weak and is often a trap.
- Read it as continuation. BOS tells you the story is unchanged. It does not tell you where to enter.
Illustrative example (not a real trade): EUR/USD makes a swing high at 1.0900, pulls back to 1.0850, then closes a 1-hour candle at 1.0912. That close is a bullish BOS. The 1.0850 low now becomes the structure you defend for the bullish idea.
Change of Character (CHoCH)
A change of character (CHoCH) is the first break of structure against the prevailing trend, and it is an early warning that the trend may be changing.
- Bearish CHoCH: in an uptrend, price closes below the most recent higher low, the low that produced the last higher high.
- Bullish CHoCH: in a downtrend, price closes above the most recent lower high, the high that produced the last lower low.
Some educators call the same event a market structure shift (MSS). Others reserve MSS for a break that comes with displacement. Check which definition your source uses before comparing notes.
| BOS | CHoCH | |
|---|---|---|
| Direction | With the trend | Against the trend |
| What it signals | Continuation | Possible reversal (a warning, not a guarantee) |
| Best context | Pullback entries in the trend direction | After a liquidity sweep at a higher-timeframe level |
| Common failure | Weak, overlapping candles (a trap) | Internal pullback inside a larger trend |
Why a CHoCH fails. The most common reason is scale. A CHoCH on the 5-minute chart inside a strong 4-hour uptrend is usually just a pullback, which brings us to the next concept.
Internal vs External Structure
External structure is the set of major swing highs and lows that define the larger trend. Internal structure is the smaller series of swings that forms inside a single external leg.
| External (swing) structure | Internal structure | |
|---|---|---|
| Purpose | Sets directional bias | Times entries and exits |
| Timeframe feel | Days to weeks | Minutes to hours |
| A break means | The trend has likely changed | Often just a pullback or continuation |
A practical rule: external structure decides which way you trade; internal structure decides when. An internal CHoCH against the external trend signals a pullback until the external structure breaks. An internal shift that aligns with external bias is a stronger trigger.
Popular tools reflect this split. LuxAlgo’s free SMC indicator, for example, plots internal and swing structure separately, with BOS and CHoCH labels for each.
Liquidity
Liquidity is the volume of orders resting at a price level that allows a large order to be filled without moving price too far. In SMC, “liquidity” usually means clusters of stop-loss and pending orders.
- Buy-side liquidity (BSL) sits above price: buy stops, breakout entries, and the stop-losses of short sellers. It is usually parked above swing highs.
- Sell-side liquidity (SSL) sits below price: sell stops, breakdown entries, and the stop-losses of long buyers. It is usually parked below swing lows.
Where liquidity typically builds
| Level | Why orders sit there |
|---|---|
| Obvious swing highs and lows | Stops go just beyond them |
| Equal highs and equal lows | Traders treat them as double tops and bottoms |
| Previous day, week and month highs/lows | Widely watched reference points |
| Session highs and lows (Asia, London) | Intraday traders reference them |
| Round numbers | Osler’s data showed clustering at rates ending in “00” |
Internal vs external range liquidity. ICT-style teaching divides liquidity into external range liquidity (above a swing high or below a swing low) and internal range liquidity (imbalances and blocks inside the range). The idea is that price travels between the two: it reaches for external liquidity, then returns to rebalance inside the range.
The takeaway: the more obvious a level looks, the more orders sit around it, and the more likely price is to visit it.
Equal Highs and Equal Lows
Equal highs and equal lows are two or more swing points at nearly the same price. They form clean-looking double or triple tops and bottoms that attract stop orders.
Traders see equal highs as resistance and place short entries below them with stops just above. Breakout traders place buy orders above. Both groups leave orders in the same spot, which makes the level a magnet for a sweep.
How to spot them
- At least two swing points within a small tolerance. A workable starting rule is “within about a tenth of the average candle range,” but test your own tolerance.
- More touches and cleaner alignment mean more obvious liquidity.
- The level should sit on a timeframe that other traders watch.
How to use them
- As a target: equal highs above a bullish idea are a natural take-profit zone.
- As a warning: do not short at equal highs just because they look like resistance. Wait for the sweep and evidence of rejection.
Liquidity Sweeps (Grabs)
A liquidity sweep occurs when price briefly trades beyond a level where orders cluster, triggers them, and then closes back inside the prior range. Many educators use “sweep” and “grab” interchangeably. Some reserve “grab” for a quick, shallow spike and “sweep” for a deeper raid that lingers.
Sweep vs genuine breakout
| Liquidity sweep | Genuine breakout | |
|---|---|---|
| Close | Returns inside the range within one to three candles | Holds beyond the level |
| Follow-through | Displacement in the opposite direction | Continuation in the breakout direction |
| Retest | Level often stays broken as a reversal | Level often holds as new support or resistance |
The trap: a sweep is not a signal by itself. Sometimes the “sweep” is the breakout, and price keeps going. That is why SMC pairs sweeps with confirmation, such as a CHoCH with displacement, before acting.
For a full walkthrough, see our guide to trading liquidity sweep reversals.
Fair Value Gaps (FVGs)
A fair value gap (FVG) is a three-candle pattern in which the wicks of the first and third candles do not overlap, leaving an unfilled price range created by a fast, one-sided move.
Anatomy of a bullish FVG (illustrative numbers):
- Candle 1 high: 1.0850
- Candle 2: a large bullish candle
- Candle 3 low: 1.0870
The gap is the zone between 1.0850 and 1.0870. Its midpoint, called consequent encroachment (CE), is 1.0860. A bearish FVG is the mirror image: candle 1’s low sits above candle 3’s high.
Why traders care.
The gap marks a stretch of price where trading was one-sided. Price often returns to it later, partly or fully, and traders watch for a reaction there.
How to use FVGs well
- Prefer FVGs created by displacement that also broke structure. A gap made by slow drift matters little.
- Higher-timeframe FVGs carry more weight than 1-minute gaps.
- Watch the reaction. A tap into the gap followed by a rejection candle is information. A candle that closes through the entire gap is a warning, and an “inverse FVG” then flips the zone’s role.
- Do not assume it must fill. In strong trends, gaps can stay unfilled for a long time.
Do not confuse it with a price gap.
A classic gap is a literal discontinuity between one session’s close and the next open. An FVG is a candle-based pattern and can appear on any continuous market, including crypto and FX.
[IMAGE SLOT 2: a real bullish FVG from your charts with the three candles numbered and CE marked. Alt text: “Bullish fair value gap showing candle 1 high, candle 3 low and consequent encroachment.”
Order Blocks
An order block (OB) is the last opposing candle before a strong, structure-breaking move. Traders treat it as a zone where large orders may have been placed and where unfilled orders may remain.
- Bullish order block: the last down (bearish) candle before a bullish displacement that breaks structure.
- Bearish order block: the last up (bullish) candle before a bearish displacement that breaks structure.
Educators disagree on whether to mark the candle’s full range (high to low) or only its body. Pick one convention and apply it consistently, because your backtest depends on it.
A five-point checklist for a valid order block
- Displacement followed it. The move away was fast and one-directional.
- It broke structure. The displacement produced a BOS or CHoCH.
- Liquidity was taken first. Ideally, a sweep occurred before the move.
- It is unmitigated. Price has not yet returned and traded through it.
- It sits in the right zone. Bullish blocks in discount, bearish blocks in premium.
An order block that meets all five is a candidate. One that meets two is clutter.
Illustrative example: price sweeps a prior low at 1.0800, then rallies hard to 1.0900, breaking a swing high. The last down candle before the rally spans 1.0812 to 1.0820. That candle is the bullish order block. A trader might wait for price to return to 1.0812–1.0820 and look for a lower-timeframe reaction, with a stop below 1.0798 (beyond the sweep low).
Order blocks and FVGs often overlap. A block that also contains or sits next to an FVG has more confluence than either alone.
When they fail. Order blocks fail regularly. A block that price closes through decisively often becomes a breaker block, covered next. For more on filtering blocks, see our guide to order blocks.
Breaker Blocks
A breaker block is a failed order block that flips role: a broken bullish order block becomes resistance, and a broken bearish order block becomes support.
It is the SMC version of the classic support-turns-resistance flip.
How one forms
- Price sweeps liquidity beyond a range.
- Structure shifts against the old direction with displacement.
- The old order block gets traded through.
- Price returns to the broken block from the other side, and traders watch for a rejection.
Breaker vs mitigation block. A commonly taught distinction is that a breaker forms after liquidity is swept before the reversal, while a mitigation block forms when price reverses without sweeping the prior extreme. Not every educator draws the line the same way, so define it in your own rules.
Trading it. Enter on a retest with a confirming candle. Place the stop beyond the far side of the breaker. If price closes back through it, the idea is wrong.
Imbalances and Voids
An imbalance is a price area where trading was heavily one-sided, so buyers and sellers did not trade evenly. A liquidity void is a larger stretch of that kind of movement, usually spanning several candles.
| Term | What it is | Size |
|---|---|---|
| Fair value gap | Three-candle gap between the first candle’s wick and the third candle’s wick | Small |
| Volume imbalance | A gap between the bodies of two consecutive candles while their wicks overlap | Small |
| Liquidity void | A long, fast move with little overlap between candles | Large |
These are all versions of the same idea. The larger and faster the move, the more attention the area tends to get on retracements. Voids are useful as targets and as areas where price may move quickly if revisited.
Price Rebalancing
Price rebalancing is the tendency of price to return to an inefficient area and trade through it more evenly before continuing or reversing.
Rebalancing can look like:
- A partial fill, where price taps the edge of an FVG and reacts.
- A CE fill, where price reaches the 50% midpoint.
- A full fill, where price trades through the entire zone.
- No fill, where price never returns (common in strong trends).
Treat rebalancing as a tendency, not a law. It tells you where to look for a reaction, not that a reaction is guaranteed. Filling an imbalance also does not equal reversal. Price can fill a gap and keep going in the same direction.
Premium and Discount Zones
Premium and discount zones split a price range at its 50% midpoint (equilibrium). Above it is “premium” (expensive) and below it is “discount” (cheap).
The rule is simple: buy in discount, sell in premium, in line with your higher-timeframe bias.
Worked example (illustrative): the current bullish leg runs from 1.0800 (low) to 1.1000 (high).
- Equilibrium: 1.0900
- Discount zone: 1.0800–1.0900
- Premium zone: 1.0900–1.1000
In a bullish bias, you look for long entries in the discount half. A long at 1.0980 is a chase in premium, with a poor risk-to-reward.
Tips
- Draw the range from the last structural swing on your bias timeframe, not from arbitrary candles.
- Use a Fibonacci tool with 0, 0.5, and 1.0 levels to mark the range.
- Premium and discount are a filter, not a trigger. It tells you where entries are cheap, not when to enter.
- In a range, the concept works well at the edges. In a strong trend, price may never reach discount, and waiting for it means missing the move.
Optimal Trade Entry (OTE)
Optimal trade entry (OTE) is a refinement of discount and premium: the retracement zone between roughly the 62% and 79% Fibonacci levels of an impulse leg, often marked with the 70.5% level as its midpoint.
Worked example (illustrative): a bullish leg from 1.0800 to 1.1000 (a 200-pip range).
| Level | Calculation | Price |
|---|---|---|
| 62% retracement | 1.1000 − (0.62 × 0.0200) | 1.0876 |
| 70.5% retracement | 1.1000 − (0.705 × 0.0200) | 1.0859 |
| 79% retracement | 1.1000 − (0.79 × 0.0200) | 1.0842 |
The OTE zone is 1.0842–1.0876. It becomes far more interesting when it overlaps an order block or FVG, because you then have several reasons to expect a reaction in one small area. It also gives a tight stop below the swing low and a reward that reaches back to the high.
Limits. OTE works best after a genuine displacement leg. If the leg was slow and choppy, the Fibonacci zone has no special meaning.
Supply and Demand Zones
A supply zone is a price area where selling previously overwhelmed buying and pushed price down sharply. A demand zone is the same for buying.
The concept predates SMC. In SMC teaching, an order block is essentially a supply or demand zone refined down to one candle, while a zone usually includes the whole small “base” of candles before the move.
How to draw a zone
- Find a sharp, impulsive departure from a small base of candles.
- Mark the base range (or the last opposing candle for an order block).
- Extend it to the right until price returns.
Fresh vs tested. A zone that price has never revisited is fresh and usually stronger. Each retest consumes some of the unfilled orders, so a zone tested three times is weaker than one tested once.
Displacement
Displacement is a strong, fast, one-directional price move, usually a few large-bodied candles that leave imbalance behind and break structure.
It is the fingerprint SMC traders look for as evidence of intent. Displacement upgrades other concepts: a BOS with displacement is more credible, an order block that produced displacement is a real candidate, and an FVG created by displacement matters more than a random one.
A testable working rule (not canon, so back-test it): treat a move as displacement if the candle bodies are clearly larger than the recent average, for example, larger than about 1.5 times the average body of the previous 10–20 candles, and the move leaves an FVG.
Propulsion Blocks
A propulsion block is a continuation-type block that forms after price has reacted from an original order block, acting as a launch point for the next leg.
Definitions vary across educators, and this is one of the most loosely defined SMC terms. For beginners, it is a low priority. If you want to use it, write a one-line rule (for example, “the small opposing candle that holds above the order block after the first tap”) and test it like any other concept.
Change in State of Delivery
A change in state of delivery (CISD) describes the moment the market stops delivering price in one direction and starts delivering it in the other.
A common way traders mark it is a close back through the open of the candle series that drove the prior move. For example, after a run of down-closing candles, a close above the open of that series signals that the sellers’ delivery has ended.
CISD is often used as a faster, lower-timeframe alternative to waiting for a full CHoCH. Faster comes with a cost: it produces more false signals. Precise definitions differ, so specify yours.
Balanced Price Range
A balanced price range (BPR) forms when two opposing fair value gaps overlap in the same price area, leaving a zone where price moved sharply both up and down.
Example: a bearish FVG forms as price drops through a level, then a bullish FVG forms as price rallies back through the same range. The overlap between the two gaps is the BPR. Traders watch for a reaction when price returns to that overlap, in line with the higher-timeframe bias.
Breakaway Gaps
A breakaway gap is a literal price gap that appears as price leaves a consolidation or pattern boundary, usually on a news catalyst or strong volume, and often marks the start of a new trend.
This comes from classic technical analysis, where gaps are grouped as common, breakaway, continuation (runaway), and exhaustion gaps. Breakaway gaps matter in SMC because they show conviction and are often left unfilled for a long time.
Do not confuse them with FVGs. A breakaway gap is an actual discontinuity in price (common at stock opens, futures sessions, and FX weekend opens). An FVG is a three-candle imbalance that can exist without any gap on the chart. Continuous markets like spot crypto have no session gaps, though CME crypto futures do.
SMT Divergences
SMT divergence (often expanded as “smart money technique” or “smart money divergence”) occurs when two closely correlated markets fail to confirm each other at a high or low. One takes out a prior extreme while the other does not.
Example (illustrative): EUR/USD sweeps its previous session low, but GBP/USD holds above its own. The failure to confirm suggests the sweep may be a liquidity grab rather than a real breakdown.
How to use it
- Compare highly correlated markets: EUR/USD and GBP/USD, or the S&P 500 and Nasdaq futures.
- Use it as confirmation for a sweep-based idea, not as a standalone signal.
- Check correlation first. Unrelated markets will diverge constantly and mean nothing.
SMC Entry Models
An SMC entry model is a fixed sequence of conditions that must occur, in order, before you enter. Models remove discretion, which is what makes them testable. Here are three common ones.
| Model 1: Sweep and reverse | Model 2: Trend pullback | Model 3: Session raid | |
|---|---|---|---|
| Bias | Higher-timeframe level (previous day high/low, equal highs/lows) | Higher-timeframe trend (BOS present) | Daily bias from higher timeframe |
| Trigger | Liquidity sweep, then CHoCH with displacement | Price pulls back into discount (or premium) | Price sweeps the Asian session high/low during the London open |
| Entry | Retracement into the FVG or order block left by the shift | Order block or FVG inside the OTE zone | Retracement into an FVG after a structure shift |
| Stop | Beyond the sweep extreme | Beyond the swing that created the zone | Beyond the session extreme |
| Target | Opposite side liquidity or last internal high/low | Prior swing high/low, then external liquidity | Opposite side of the Asian range, then higher |
| Invalidation | A close back through the sweep extreme | A close through the zone and swing | A structure break against the daily bias |
| Skip when | No displacement after the sweep | Price is not in discount/premium | Choppy Asian range with no clear high/low |
Choose one model and master it before you add another. Traders who learn everything at once usually master nothing.
SMC Trading Strategies
A smart money concepts strategy (an SMC trading strategy) combines individual concepts into an ordered decision process: bias first, then zones, then timing, then risk. Concepts describe the chart. A strategy tells you what to do about it.
A six-step framework
- Set bias on the higher timeframe. Use Daily and 4-hour structure. Are you bullish, bearish, or neutral? If neutral, do not trade.
- Map liquidity. Mark the obvious highs and lows above and below price: previous day, week, session, and equal levels.
- Identify points of interest (POIs). Find FVGs and order blocks that formed with displacement, in the correct premium or discount zone.
- Wait for price to arrive. Do nothing until price reaches a POI during an active session.
- Confirm on a lower timeframe. Look for a sweep, a CHoCH or BOS with displacement, and an entry zone.
- Define risk and targets, then log it. Stop beyond invalidation, targets at liquidity, size by risk percentage, screenshot and journal.
The SMC confluence scorecard
To keep discretion honest, score each setup before entering. This is a starting template: adjust the items, then test whether higher scores actually produce better results.
| Criterion | Point |
|---|---|
| Higher-timeframe structure supports the direction | 1 |
| A clear liquidity level was swept | 1 |
| The shift showed displacement | 1 |
| The entry zone (FVG/OB) formed from displacement | 1 |
| Entry is in discount (buys) or premium (sells) | 1 |
| Trade occurs inside a preferred session window | 1 |
| Reward to the first liquidity target is at least 2R | 1 |
| No high-impact news within your no-trade window | 1 |
A rule you can test: trade only setups scoring 6 or more. After 100 trades, compare the results of high and low scores. If there is no difference, the scorecard is decoration and should change.
What about a smart money concepts indicator?
SMC trading is easier to learn with software help. Indicators such as LuxAlgo’s popular SMC script automate the markup: internal and swing BOS and CHoCH, order blocks, equal highs and lows, fair value gaps, and premium/discount zones. They help you learn faster and reduce drawing time. They also have limits, covered in the FAQ below.
London Session Behavior
The London session is the most liquid window for currency trading, and in SMC teaching it often sets the high or low of the day by sweeping the Asian session’s range.
The UK, US, Singapore, and Hong Kong together accounted for 75% of global FX trading in April 2025, according to BIS, and the UK has traditionally been the largest single center. That helps explain why London’s open tends to bring the day’s first real liquidity.
Typical pattern: Asia builds a tight range. At the London open, price runs above or below that range (sweeping the stops there), then reverses into the direction of the daily move. ICT-style teaching calls the London window from roughly 02:00 to 05:00 New York time the “London kill zone.”
What to do
- Mark the Asian high and low before London opens.
- Watch for a sweep of one side followed by a structure shift.
- Skip the trade if London simply drifts sideways with no sweep and no displacement.
Timing note: clock changes matter. In 2026, the UK moves back to standard time on October 25, while the US moves back on November 1. For that one week, the London-to-New York gap is four hours instead of five, so session windows expressed in New York time shift relative to London. Verify times with a converter before each season change.
New York Session Behavior
The New York session often builds on or reverses London’s move, with sharp reactions around 8:30 a.m. ET US economic data releases and the 9:30 a.m. ET stock market open.
| Window (New York time) | What often happens |
|---|---|
| 07:00–10:00 (the commonly cited “NY kill zone”) | Highest volatility of the US day; continuation or reversal of the London move |
| 08:30 (inside that window) | US economic data releases can trigger fast spikes and sweeps |
| 09:30 | US stock market open adds volume, especially to index futures |
| Midday | Volume thins; price often chops |
| Afternoon | Slower, sometimes cleaner moves; later reversals are common |
How to use it. London typically leaves liquidity: its high, its low, and unfilled imbalances. New York often reaches for those levels. If London made the low of the day and broke structure up, New York morning pullbacks into discount are common candidates for long ideas. If London made no clear direction, New York can do the sweeping and reversing itself.
Caution. These are tendencies, not schedules. Many days do not follow the template, and a news shock can override everything.
Power of Three
Power of Three (PO3), also called AMD, describes a three-phase cycle: accumulation, manipulation, and distribution.
- Accumulation: price consolidates and builds positions quietly, often during the Asian session.
- Manipulation: price makes a false move, sweeping liquidity in one direction. Traders sometimes call this a “Judas swing.”
- Distribution: the real move runs in the opposite direction, often through London and New York.
It is the daily-candle version of the sweep-then-reverse idea, and it echoes Wyckoff’s accumulation and distribution phases.
A daily bullish example: the day opens, price dips below the Asian low (manipulation), takes out the sell stops, then reverses and closes well above the open (distribution). The low made during the false move is the day’s low.
Limits. Many days trend from the open without a manipulation leg. If the setup is not clean, stand aside. Forcing a pattern onto a day that does not fit is a common source of losses.
Stop Placement Using SMC
In SMC, a stop belongs beyond the point that proves your idea wrong, not at a random distance from your entry.
| Setup | Logical invalidation | Stop placement |
|---|---|---|
| Bullish order block after a sweep | The sweep low | Just below it, plus a buffer |
| Bullish FVG entry | The low of the displacement candle (tight) or candle 1 (conservative) | Just below your chosen level, plus a buffer |
| Breaker block | The far side of the breaker | Just beyond it |
| CHoCH entry | The swing extreme that produced the CHoCH | Beyond it |
Add a buffer. Spreads, wicks, and volatility are real. A common approach is to add a fraction of the average true range (ATR) to the stop. Test your buffer, because too tight gets you stopped by noise and too wide ruins your reward-to-risk.
Watch out for round numbers. Osler’s data showed stop-loss orders clustering at round numbers such as a level ending in “00”. A stop placed exactly on the round number is a stop everyone else has too. Consider placing it a few pips beyond.
Size the position from the stop, not the other way around.
Position size = (account balance × risk %) ÷ (stop distance × value per pip)
Illustrative example: $10,000 account, 1% risk = $100. A 25-pip stop on EUR/USD, where one standard lot is worth roughly $10 per pip, gives 100 ÷ (25 × 10) = 0.4 lots. If your stop is too wide to fit your risk, you do not trade the setup, or you reduce size. You do not tighten the stop until it becomes meaningless.
Liquidity-Based Take Profits
Liquidity-based targets place your take-profit at the next pool of resting orders, because price is often drawn toward them.
A tiered approach
- Target 1: the nearest internal high or low (a minor swing or the far edge of an FVG).
- Target 2: external range liquidity, such as equal highs/lows or the previous day’s high/low.
- Target 3: a higher-timeframe pool (weekly high/low).
Rules of thumb
- Only trade setups where the first meaningful target is at least about 2R away. If the nearest liquidity is 0.8R away, skip.
- Consider taking partial profits at Target 1 and moving the stop to breakeven only when structure supports it.
- Exit slightly before obvious equal highs or lows. If the liquidity narrative is right, price often pierces the level and reverses, so a target exactly on the level can miss by a few pips.
A caution: targets at obvious liquidity are targets everyone else has too. Always check whether structure between you and the target could stop the move first.
Confirmation vs Anticipation Entries
A confirmation entry waits for price to prove your idea (for example, a CHoCH with displacement). An anticipation entry places an order at a zone before proof arrives.
| Confirmation | Anticipation | |
|---|---|---|
| Entry timing | After a structure shift | At the zone, before proof |
| Typical win rate | Higher | Lower |
| Typical reward-to-risk | Lower (entry is further from the stop) | Higher (entry is close to the stop) |
| Missed trades | More | Fewer |
| Best suited to | Beginners; newly learned models | Experienced traders with tested, tight rules |
Neither is “better.” The difference is a trade-off between hit rate and reward. What matters is that you decide in advance which you use and test it. Traders who flip between the two based on mood usually get the worst of both.
How to Backtest SMC
Backtesting SMC means writing your rules precisely enough that another trader would mark the same setups on the same chart, then recording every trade on historical data before risking real money.
Some critics argue SMC cannot be tested because two traders mark charts differently. That is true of vague versions. The fix is to remove the vagueness.
A step-by-step protocol
- Write the rules. Define your swing (for example, three-candle), displacement, order block convention (body or full range), POI filter, entry trigger, stop, targets, sessions, and news filter.
- Choose one market and one model. Testing everything at once teaches nothing.
- Use replay. Use a bar-replay feature so you cannot see future candles. Hindsight bias is the main enemy.
- Log every trade. Record date, market, timeframe, model, entry, stop, target, result in R, scorecard points, and a screenshot.
- Include costs. Spreads and commissions change results.
- Then forward-test on demo for at least a month before going live at small size.
How many trades are enough?
Small samples fool people. The standard error of an observed win rate near 50% is roughly:
| Trades | Approximate uncertainty (±1 standard error) |
|---|---|
| 30 | ±9 percentage points |
| 100 | ±5 points |
| 200 | ±3.5 points |
With 30 trades, a 55% win rate is statistically indistinguishable from 45% or 65%. Aim for 100 or more trades per model and market before concluding.
Judge by expectancy, not win rate
Expectancy (in R) = (win rate × average win in R) − (loss rate × average loss in R)
Example: 40% win rate, average win 2.5R, average loss 1R → (0.40 × 2.5) − (0.60 × 1) = +0.40R per trade. A 40% win rate can be profitable, and a 70% win rate can lose money if the losers are large.
Also check maximum drawdown and the longest losing streak. Can you psychologically and financially survive it?
A word of caution about published results. Some websites cite backtests showing win rates of 50–65% for SMC-style strategies. We could not verify the methodology behind these claims, and they should not be treated as evidence. Your own test on your own rules is the only result that matters to your account.
Common SMC Mistakes
Most SMC losses come from process problems rather than from a broken framework. Each mistake below has a fix.
Trying to learn everything at once
SMC has dozens of terms. Beginners memorize them all, then cannot decide which matters on a live chart. Fix: learn in this order: structure, liquidity, one zone type (FVG or order block), one entry model. Add nothing else until that model has 100 logged trades.
Marking every fair value gap or order block on the chart
A chart covered in colored rectangles is not analysis. Price will react to something everywhere. Fix: only keep zones that came from displacement, broke structure, and sit at a meaningful level. Delete the rest.
Ignoring higher timeframes
A perfect-looking 1-minute setup against a 4-hour trend is usually a pullback trap. Fix: write your higher-timeframe bias before looking at the entry timeframe. If the two disagree, trade smaller or skip.
Trading every BOS or CHoCH like it is a setup
A structure break is a piece of information, not a trade. Fix: require context: a POI, liquidity taken, displacement, and a session window. Use the confluence scorecard.
Entering too early during a liquidity sweep
Sweeps can run much further than expected, and the first bounce is often not the reversal. Fix: wait for price to close back inside the range and show a structure shift before you enter. Accept that you will miss the very top or bottom.
Ignoring market sentiment or news events
High-impact releases can sweep every level in seconds and ignore every zone you drew. Fix: check the economic calendar each morning. Set a no-trade window around major releases, or reduce size.
Forcing SMC onto sideways markets
In a tight range, every candle looks like a sweep or a shift. Most of it is noise. Fix: if structure has no clear direction and displacement is absent, stand aside or trade only the range edges with small size.
Not having a risk management plan
A correct read can still lose. Without a fixed risk, one oversized loss erases weeks of work. Fix: risk a small fixed percentage per trade (many traders use 1% or less), set a daily loss limit, and calculate size from the stop.
Overconfidence after a few wins
Variance can make a random process look skilled for a while. Even a zero-edge system can win in bursts. Fix: measure performance over at least 100 trades, keep position size fixed, and review losers as carefully as winners.
Frequently Asked Questions
What is smart money concepts?
Smart money concepts (SMC) is a price-action framework that uses market structure, liquidity, and price imbalances to estimate where large market participants have orders. Traders use it to select entries, stops, and targets. It is a method of reading charts, not a guaranteed strategy.
What are the key principles behind smart money concepts?
Five principles carry most of the framework: (1) market structure shows who is in control, (2) liquidity clusters at obvious highs and lows, (3) sweeps and displacement reveal intent, (4) imbalances such as FVGs and order blocks mark zones of interest, and (5) trades should occur at a favorable price (discount or premium) with a defined invalidation point.
How is SMC different from traditional technical analysis?
Traditional technical analysis often leans on indicators built from past price, such as moving averages and oscillators. SMC works from raw price, structure, and liquidity, and asks why a level might matter. In practice, SMC is a specialized branch of price-action analysis rather than a separate discipline, and it overlaps with older ideas like support, resistance, supply and demand, and Wyckoff.
How do smart money concepts differ from traditional investing strategies?
Traditional investing usually rests on fundamentals (earnings, valuation, macro conditions) and holds positions for months or years. SMC is a short-term trading approach based on price behavior, typically holding positions from minutes to days, with a stop-loss on every trade. It is not designed for long-term portfolio building.
What are smart money concepts in forex trading?
In forex, SMC uses currency price charts to find where liquidity sits (session highs and lows, previous day and week levels, round numbers) and to time entries around the London and New York sessions. Forex suits the approach because it is highly liquid, trades nearly 24 hours a day, and shows clean session structure. Leverage is the main danger, because it magnifies losses.
Is smart money concepts legit?
SMC is legitimate as a vocabulary and framework for reading price, and its central idea that stop orders cluster at predictable levels has support in academic research. It is not proven as a standalone, profitable system, and no rigorous independent study shows an edge. Be cautious of anyone who sells guaranteed results, screenshots without full trade records, or expensive mentorships built on cherry-picked wins.
Is SMC good for beginners?
It can be, if you start small. Learn market structure and liquidity first, add one zone type and one entry model, and practice on demo. It is a poor fit if you try to learn every concept at once or trade with money you cannot afford to lose.
Does smart money concepts work?
It works to the extent that your specific rules, applied consistently with sound risk management, produce a positive expectancy in your own tests. The framework alone does not create an edge. Test your rules on at least 100 trades per model before trusting them.
Does SMC work in forex, crypto, stocks, and commodities?
The core ideas of structure, liquidity, and imbalance apply to any liquid market because they describe how orders interact with price. Details change: forex has clean session behavior, crypto trades 24/7 with faster spikes, stocks react to earnings and open gaps, and commodities react to inventory and geopolitical news. Test each market separately rather than assuming results transfer.
Is there a smart money concepts indicator?
Yes. Several charting platforms offer a smart money concepts indicator that automatically draws structure breaks, order blocks, equal highs and lows, FVGs, and premium/discount zones. Indicators help you learn and save drawing time, but most confirm swing points only after they form, so labels appear with a delay. They also mark far more zones than are worth trading. Use them as a drawing assistant, not a signal generator.
Where can beginners learn smart money concepts online?
Free sources include ICT’s own YouTube archive (the origin of much SMC material), charting-platform education pages, and educator blogs. When evaluating any course, look for: clear written rules, full trade records rather than screenshots, honest discussion of losing periods, no income promises, and a refund policy. Avoid anything that guarantees profits. Our upcoming beginner series on this site walks through the same concepts in order.
Sources and Editorial Standards
How we researched this guide. Definitions follow common usage across SMC and ICT educators, and where educators disagree, we say so. Statistics link to their original publisher. Chart examples are labeled illustrative unless taken from documented trades. We do not accept payment to change what this guide says about a product or course.
Primary sources
- Bank for International Settlements. Global FX trading hits $9.6 trillion per day in April 2025 and OTC interest rate derivatives surge to $7.9 trillion: Triennial Survey. September 30, 2025. bis.org
- Osler, C. L. Stop-Loss Orders and Price Cascades in Currency Markets. Federal Reserve Bank of New York Staff Report No. 150 (2002); Journal of International Money and Finance 24(2), 2005, pp. 219–241. newyorkfed.org
- Osler, C. L. Support for Resistance: Technical Analysis and Intraday Exchange Rates. Federal Reserve Bank of New York Economic Policy Review 6(2), July 2000, pp. 53–68. newyorkfed.org
- European Securities and Markets Authority. ESMA agrees to prohibit binary options and restrict CFDs to protect retail investors. March 27, 2018. esma.europa.eu
- LuxAlgo. Smart Money Concepts / ICT Concept (concept library, includes a critical assessment of the framework). luxalgo.com
Limitations. The Osler studies use foreign exchange data from around 1999–2000 and one dealer’s order book. They support the idea that orders cluster and can accelerate moves. They do not validate any specific SMC pattern.
Corrections policy. If you spot an error, contact us at tradingxone88@gmail.com, and we will review and update the article, noting the correction date.
Continue Learning
This guide is the hub for our smart money concepts series. Each article below goes deeper on one concept:
- How to Spot Trend Reversals Before a CHoCH
- Liquidity Sweep Reversals: A 15-Minute Trading Strategy
- Order Blocks: How to Filter the Ones That Actually Matter
- The Smart Money Concepts Trading Strategy, Step by Step
- Premium and Discount Zones and OTE: A Practical Guide
- Fair Value Gaps: A Complete Guide